%%file wordcount.py
import sys, os
from pyspark import SparkContext, SparkConf
if __name__ == "__main__":
# create Spark context with Spark configuration
conf = SparkConf().setAppName("WordCount")
sc = SparkContext(conf=conf)
# read in text file and split each document into words
words = sc.textFile("file:///srv/data/sample.txt").flatMap(lambda line: line.strip().lower().replace(".","").split(" "))
# count the occurrence of each word
wordCounts = words.map(lambda word: (word, 1)).reduceByKey(lambda a,b:a +b)
wordCounts.saveAsTextFile(os.path.join("output"))Spark dataframes on HDFS
We look at the New York City Taxi Cab dataset. This includes every ride made in the city of New York since 2009.
On this website you can see the data for one random NYC yellow taxi on a single day.
On this post, you can see an analysis of this dataset. Postgres and R scripts are available on GitHub.
Loading the data
Normally we would read and load this data into memory as a Pandas dataframe. However in this case that would be unwise because this data is too large to fit in RAM.
The data can stay in the hdfs filesystem but for performance reason we can’t use the csv format. The file is large (32Go) and text formatted. Data Access is very slow.
You can convert csv file to parquet with Spark.
from pyspark.sql import SparkSession

spark = SparkSession.builder \
        .appName("Convert CSV to parquet") \
        .master("spark://b2-120-gra11:7077") \
        .getOrCreate()

df = spark.read.csv("hdfs://b2-120-gra11:54310/data/nyctaxi/2018/yellow*.csv",
                    header="true",inferSchema="true")

df.write.parquet("hdfs://b2-120-gra11:54310/user/jupyter-navaro_p/2018-yellow.parquet")

spark.stop()
Spark Cluster
A Spark cluster is available and described on this web interface
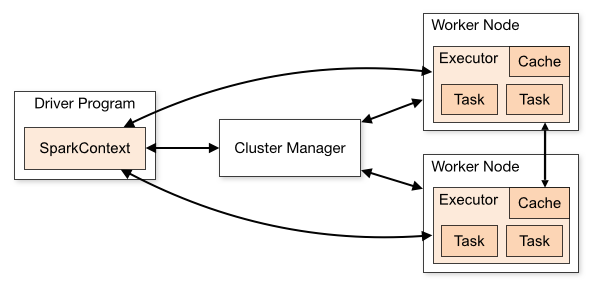
The SparkSession is connected to the Spark’s own standalone cluster manager (It is also possible to use YARN). The manager allocate resources across applications. Once connected, Spark acquires executors on nodes in the cluster, which are processes that run computations and store data for your application. Next, it sends your application code (Python file) to the executors. Finally, tasks are sent to the executors to run.
Spark can access to files located on hdfs and it is also possible to access to local files. Example:
spark-submit.sh
The spark-submit script is used to launch applications on a cluster. It can use all of Spark’s supported cluster managers through a uniform interface so you don’t have to configure your application especially for each one.
Example
Launch your spark application using the command line
spark-submit wordcount.pyUse Ctrl-C to stop it if you have a problem. If the environment variable HADOOP_HOME is set the output will be write on the HDFS. Display the results with:
hdfs dfs -cat output/*- Don’t run the python code inside a notebook cell. Save a python script and launch it from a terminal instead. In Jupyter notebook you won’t see any progress or information if error occurs.
- Documentation of
spark-submitcommand shell to run your script on the cluster. - You can control the log with
spark.sparkContext.setLogLevel('ERROR')Valid log levels include: ALL, DEBUG, ERROR, FATAL, INFO, OFF, TRACE, WARN
Try your script with a single file before to do it for whole data.
Read carefully your script before, don’t submit many times.
Some examples that can be run on the cluster
- Here we read the NYC taxi data files of year 2018 and select some variables.
from pyspark.sql import SparkSession
spark = SparkSession.builder \
        .master('spark://b2-120-gra11:7077') \
        .getOrCreate()
spark
columns = ['tpep_pickup_datetime', 'passenger_count', 'payment_type', 'fare_amount',
'tip_amount', 'total_amount']
df = (spark.read.parquet("hdfs://localhost:54310/data/nyctaxi/2018.parquet/").select(*columns))- Sum the total number of passengers
df.agg({'passenger_count': 'sum'}).collect()- Average number of passenger per trip`
df.agg({'passenger_count': 'avg'}).collect()- How many trip with 0,1,2,3,…,9 passenger`
df.groupby('passenger_count').agg({'*': 'count'}).collect()Example
How well people tip based on the number of passengers in a cab. To do this you have to:
- Remove rides with zero fare
- Add a new column
tip_fractionthat is equal to the ratio of the tip to the fare - Group by the
passenger_countcolumn and take the mean of thetip_fractioncolumn.
- To remove rows
df = df.filter(df.name == 'expression')- To make new columns
df = df.withColumn('var2', df.var0 + df.var1)- To do groupby-aggregations
df.groupBy(df.name).agg({'column-name': 'avg'})When you want to collect the result of your computation, finish with the .collect() method.
(df.filter(df.fare_amount > 0)
   .withColumn('tip_fraction', df.tip_amount / df.fare_amount)
   .groupby('passenger_count').agg({'tip_fraction': 'avg'})).collect()